Prometheus + Grafana
Operation and maintenance related knowledge

1. Background introduction
1.1 Prometheus
The Chinese is Prometheus, just by hearing the name, I feel very fanciful, and it is a very powerful thing. Let me talk about the story of Prometheus, he is a figure in the myth of Athens, the legend is that he fabricated the human form, and Athena gave each human form a soul. Zeus forbids humans to use fire. Seeing that humans are in distress, this buddy stole fire from Apollo, so he offended Zeus. After that, Zeus locked him on the cliff of Caucasus Mountain and released a fire every day. The evil eagle pecked at his liver, and made his liver grow back every day, making him suffer all kinds of pain. This myth is quite interesting, so we can see that Prometheus is the patron saint of mankind. He came to endure all kinds of suffering and protect mankind. So what I’m talking about today also has this function, it’s a performance monitoring tool, it’s an open-source monitoring & alarming system based on time series written in Go language.
It is based on the HTTP protocol to capture the status information of the monitored point, so it supports a wide range of components. Any component that supports the HTTP protocol can use it as a monitored point, so it is also widely used in docker, k8s and mesos environments. monitor. The HTTP interface for outputting the monitored component information is exporter. Currently, many commonly used components of Internet companies can directly use exporter.
1.2 Grafana
An open source program for visualizing large measurement data, providing a powerful and elegant way to create, share, and browse data. Grafana and Prometheus are used together to display the running status of the service in a graphical interface.
2. Practical drills
I used vagrant + virtual Box to set up three instances, and the process in the middle was full of twists and turns. The main reason was that I was not familiar with vagrant. In fact, vagrant is an isolation of the development environment, which is a bit like docker, through box mirroring To isolate different development environments. When using vagrant, I reviewed the network configuration, mainly the difference between NAT, bridge, host-only, switch and router.
Let’s talk about the difference between a switch and a router first. This should be encountered frequently. First of all, the two levels in the OSI seven-layer model are different. The switch is at the second layer, the data link layer, and the router is at the second layer. It is in the third layer, the network layer. The switch uses the physical address to determine the destination address of the data, and the router uses the network ID number to address. The different ways of the two are destined to have different functions. A switch can be understood as having more LAN ports, and the network of each LAN port does not interfere with each other. The router is just the opposite. Multiple LAN ports share a total network port, so it is a shared network bandwidth.
NAT: Network address translation is the function of the virtual machine to access the public network through the network where the host machine is located through the NAT function. In NAT mode, other hosts in the LAN cannot access the virtual machine, and the virtual machine can access all hosts in the LAN.
Bridging: The local physical network card and the virtual network card are bridged through the virtual switch, and the virtual switch is equivalent to the switch in the real network.
host-only: The virtual network is in a fully closed network, and the only thing that can be accessed is the host.
There are three instances in total, one is to install prometheus, one is to install granfan, and the other is to install node_exporter.
-
Install and start prometheus
1
2
3
4
5
wget https://github.com/prometheus/prometheus/releases/download/v2.7.1/prometheus-2.7.1.linux-amd64.tar.gz tar -xvzf prometheus-2.7.1.linux-amd64.tar.gz -C /usr/local/ mv prometheus-2.7.1.linux-amd64 prometheus ./prometheus --config.file="prometheus.yml" & (background running) lsof -i:9090 (list port process)
After finishing, start prometheus, the port occupied is port 9090, and the performance monitoring starts.
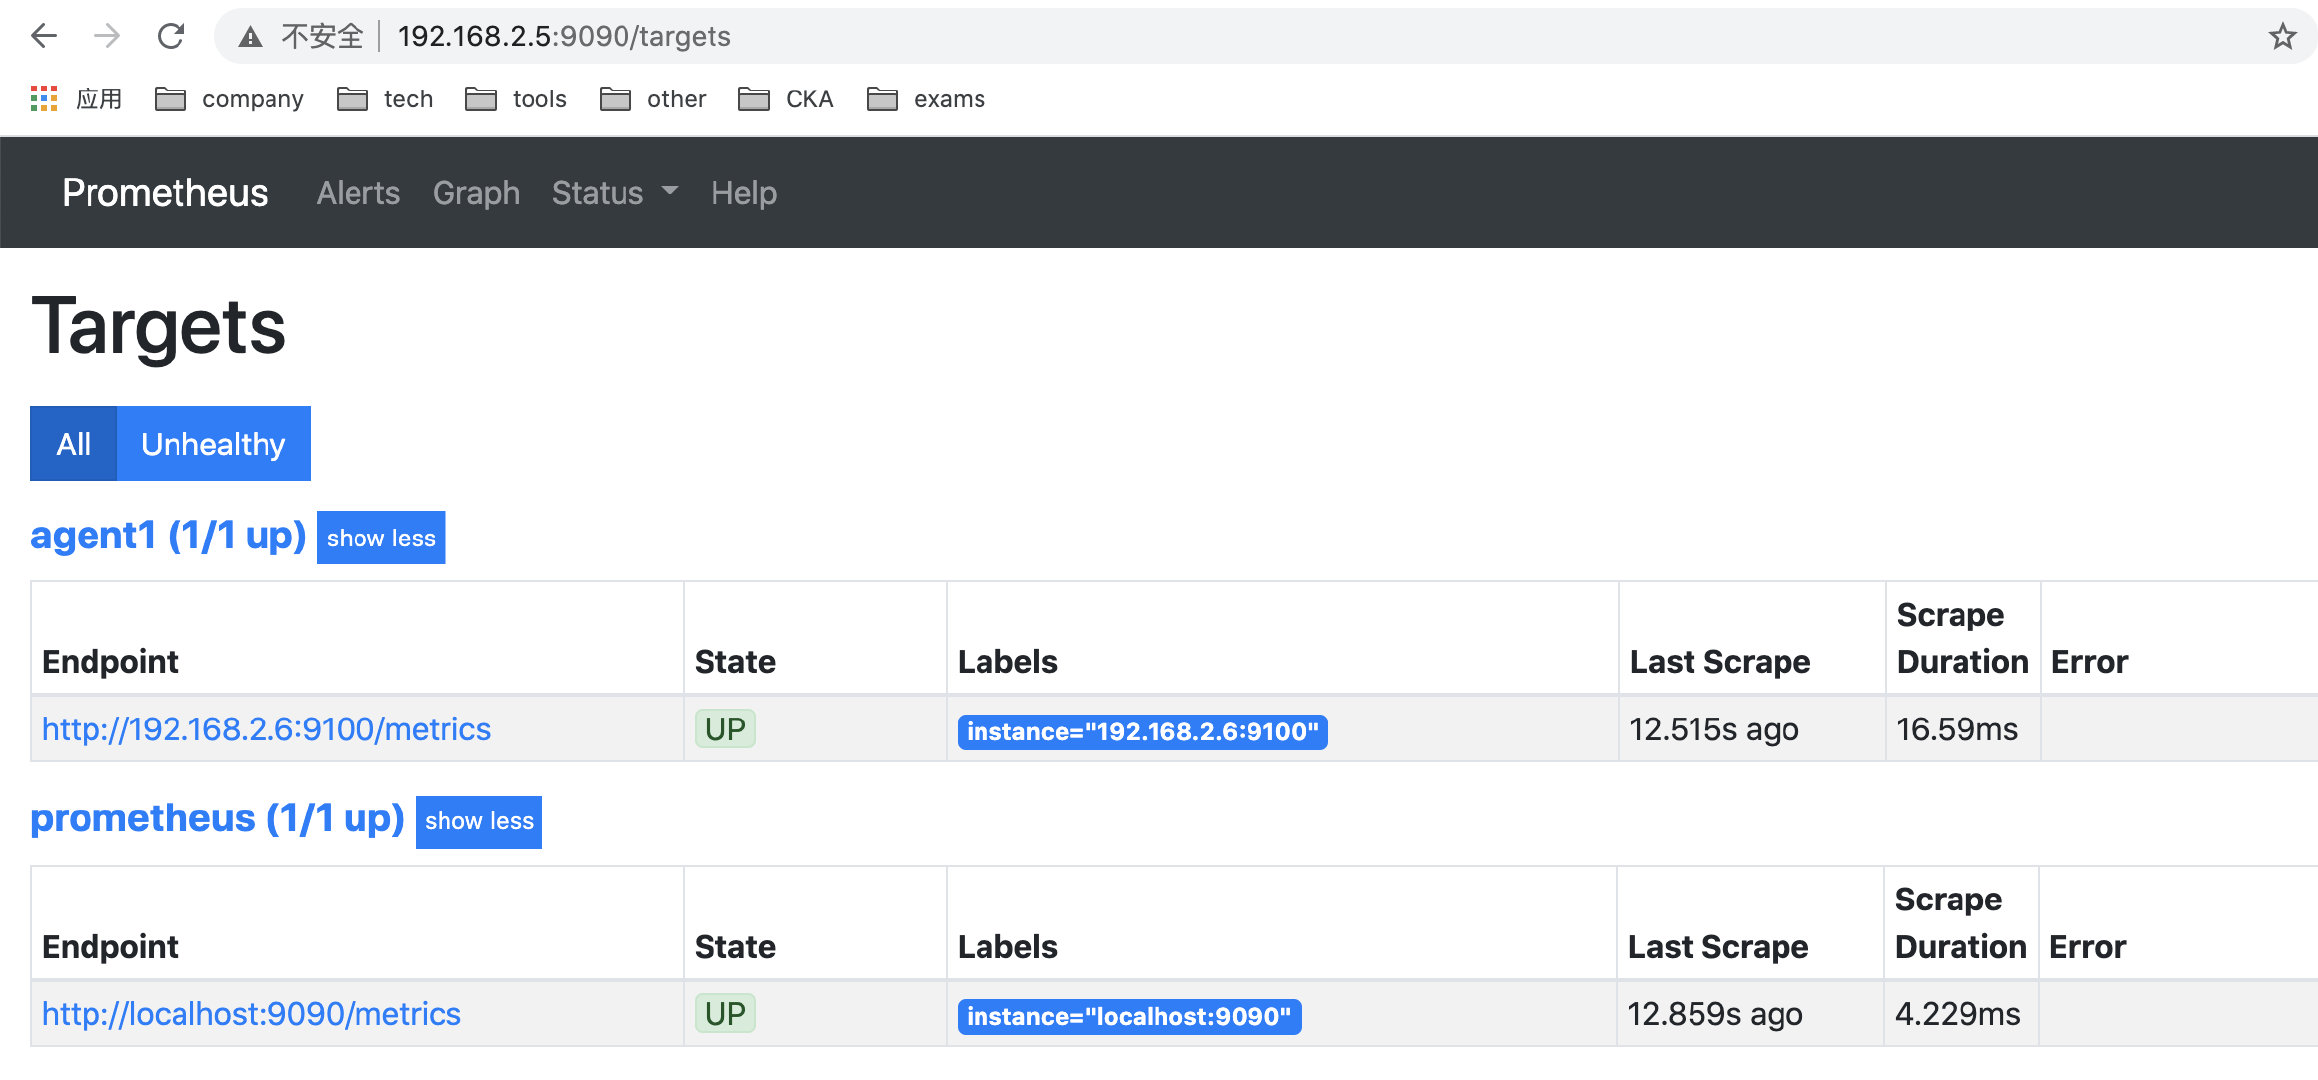
Setting the target is the monitoring target. By default, the monitoring target is yourself, and you can also set other node nodes for monitoring.
-
Install and start the node_exporter node
1
2
3
curl -OL https://github.com/prometheus/node_exporter/releases/download/v0.15.2/node_exporter-0.15.2.darwin-amd64.tar.gz tar -xzf node_exporter-0.15.2.darwin-amd64.tar.gz nohup /usr/local/node_exporter/node_exporter
This starts node_exporter, and you can see it after entering it. In fact, it is a bunch of logs like the picture below.
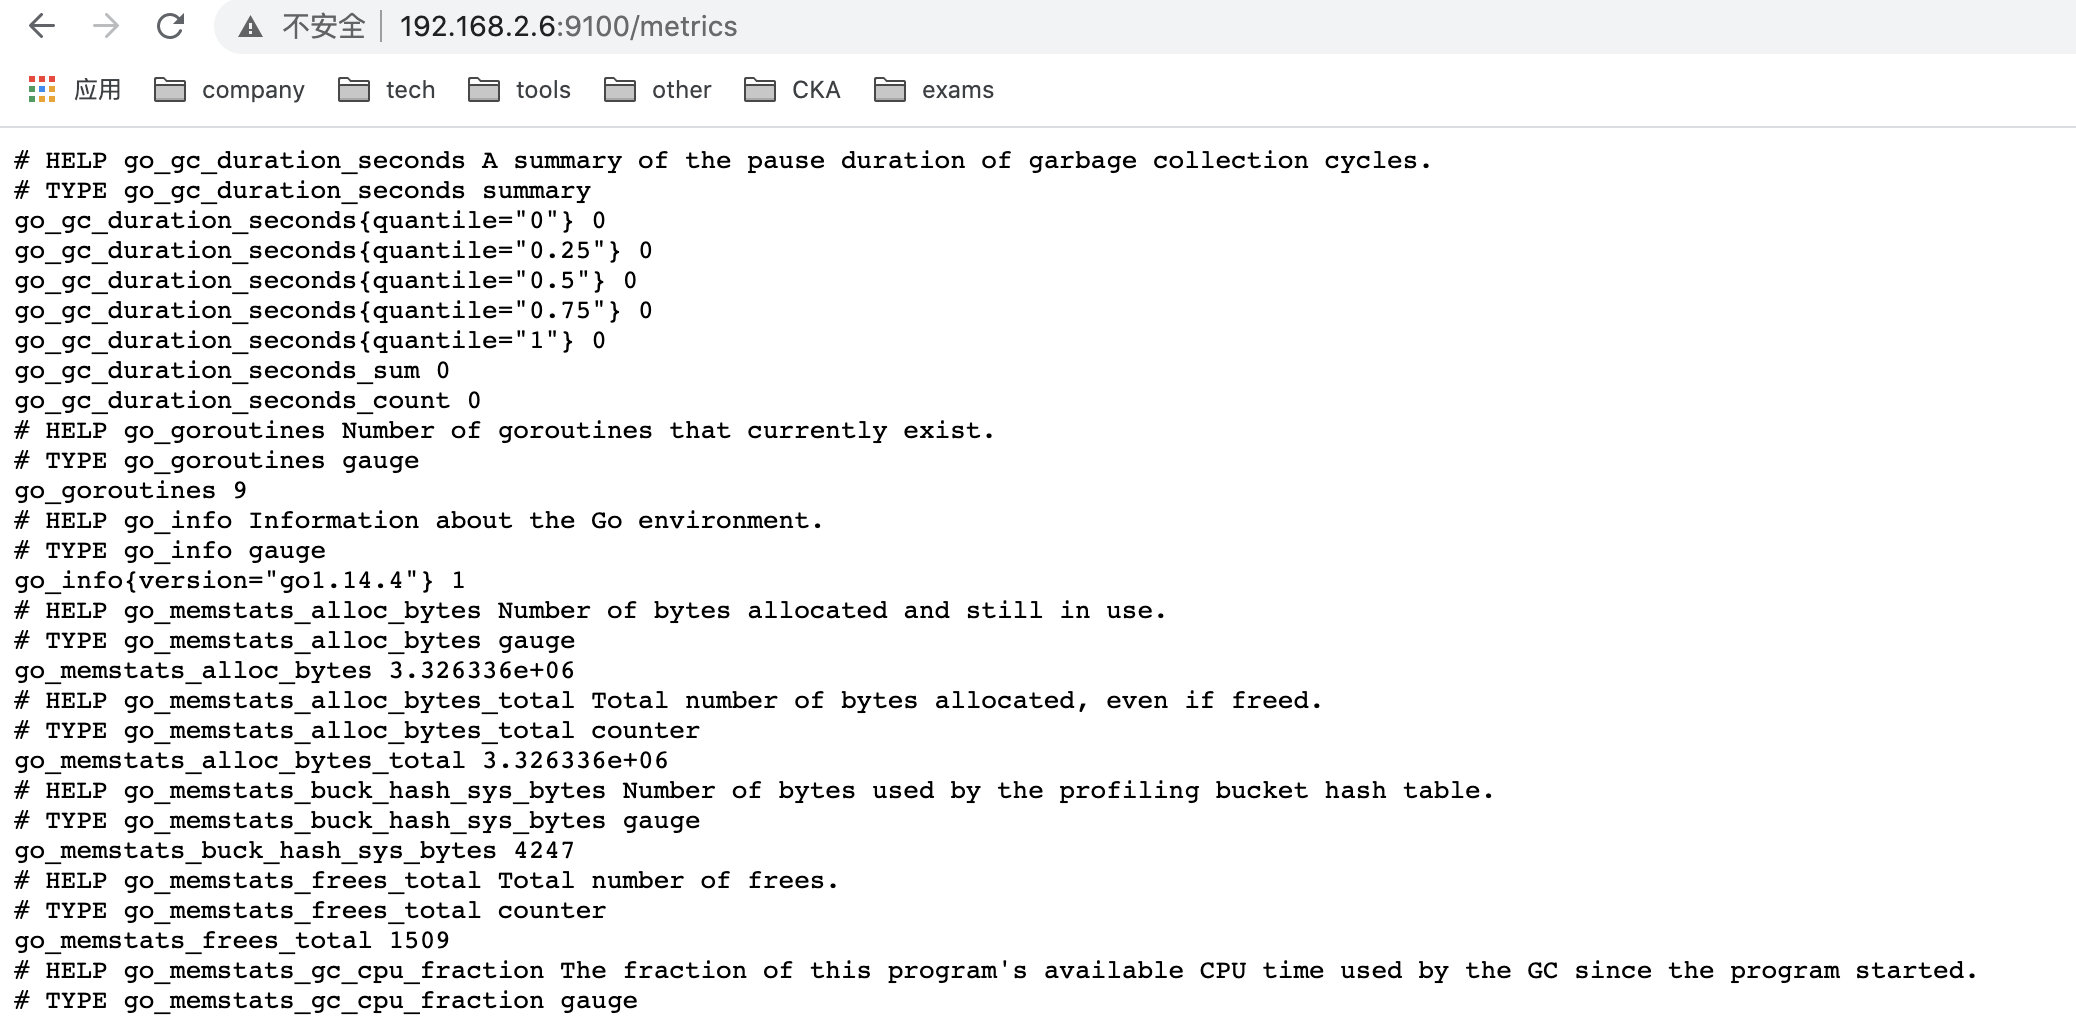
These logs can be called and displayed by prometheus.
- Granfan installation and startup
This is a performance monitoring tool with a graphical interface, and it is very simple to install and start.
|
|
Prometheus can be added to monitoring with dashboard through Grafana.
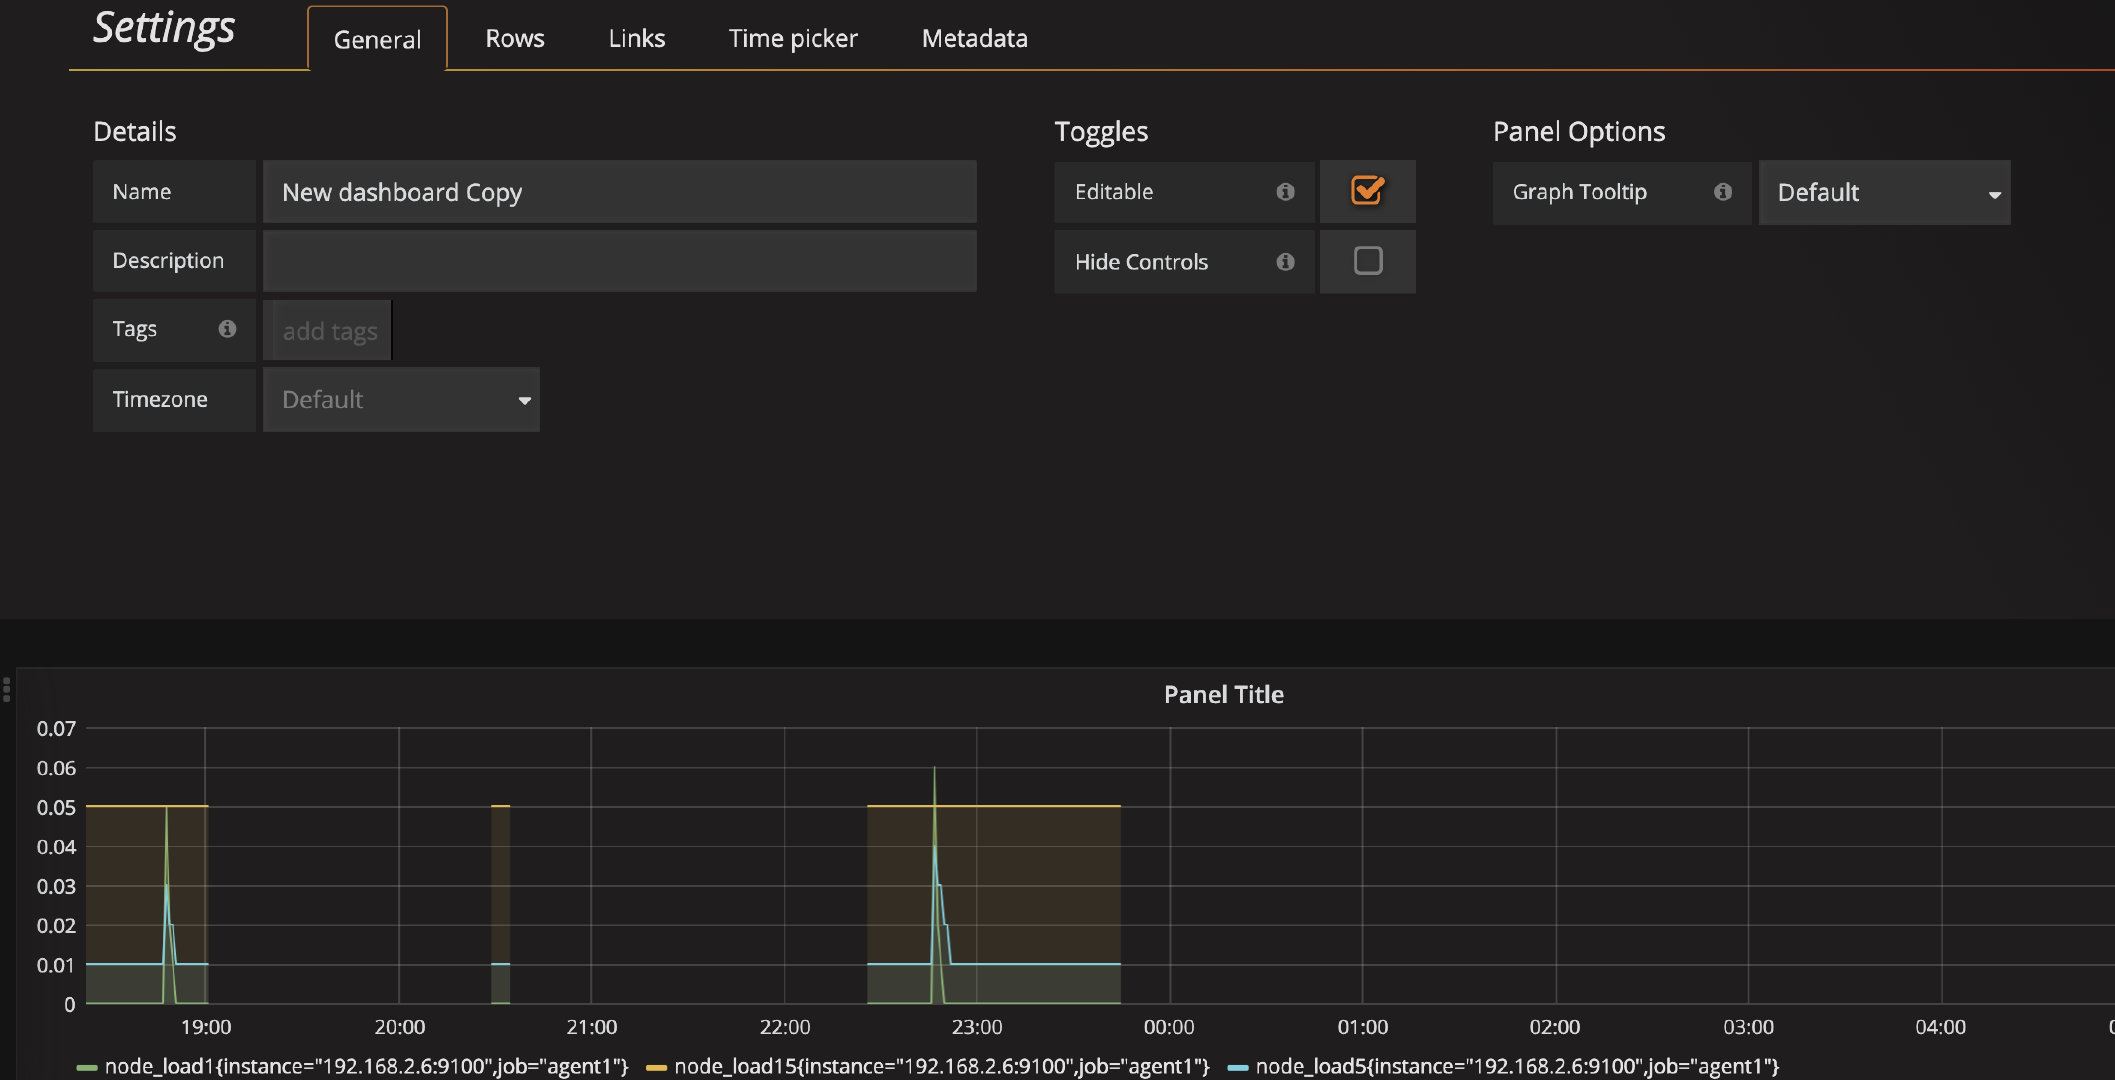
Overall, it’s relatively simple.
3. The combination of k8s and prometheus, Granfan
https://www.qikqiak.com/post/kubernetes-monitor-prometheus-grafana/
This blog post is also a good example of the combination of k8s and prometheus Granfan.
4. Prometheus common problems
https://www.ershicimi.com/p/b27a4437ff01832f1832c563a8a00437