Linux problem location and performance optimization
Operation and maintenance related knowledge

1.1 Average Load and CPU Utilization
These two are usually key indicators to measure the current performance of the system, but you can’t just study one and give up the other, you need to view and analyze the two together.
Average load: Refers to the operating status of the system and the number of processes in the uninterruptible status per unit time.
***CPU usage: It refers to the usage of CPU, which is also our common understanding. ***
Well, fine product, you can actually feel some differences between the two. We know that, in fact, a single-core CPU can only run one process at a time point, which is also the most ideal state, so if at a certain point in time, how many A process is grabbing the CPU, which is actually not good, and the average load will increase. The uninterruptible state refers to those IO processes, such as reading and writing hardware in the kernel mode. The system is unwilling to interrupt such processes.
So it is easy to understand that a high average load does not necessarily mean a high CPU utilization rate. For example, if there are many IO processes, the CPU utilization rate may not be high at this time. While the CPU utilization rate is high, the average load is not necessarily high. For example, if multiple threads are using the CPU in a single process, the CPU utilization rate is also high at this time, but the average load is not high.
1.2 Example analysis
-
CPU intensive process
Simulate a CPU-intensive process, with a single CPU usage reaching 100%, and then look at the average load usage.

Start a process, adjust the CPU usage to 100%, and then check the load average.
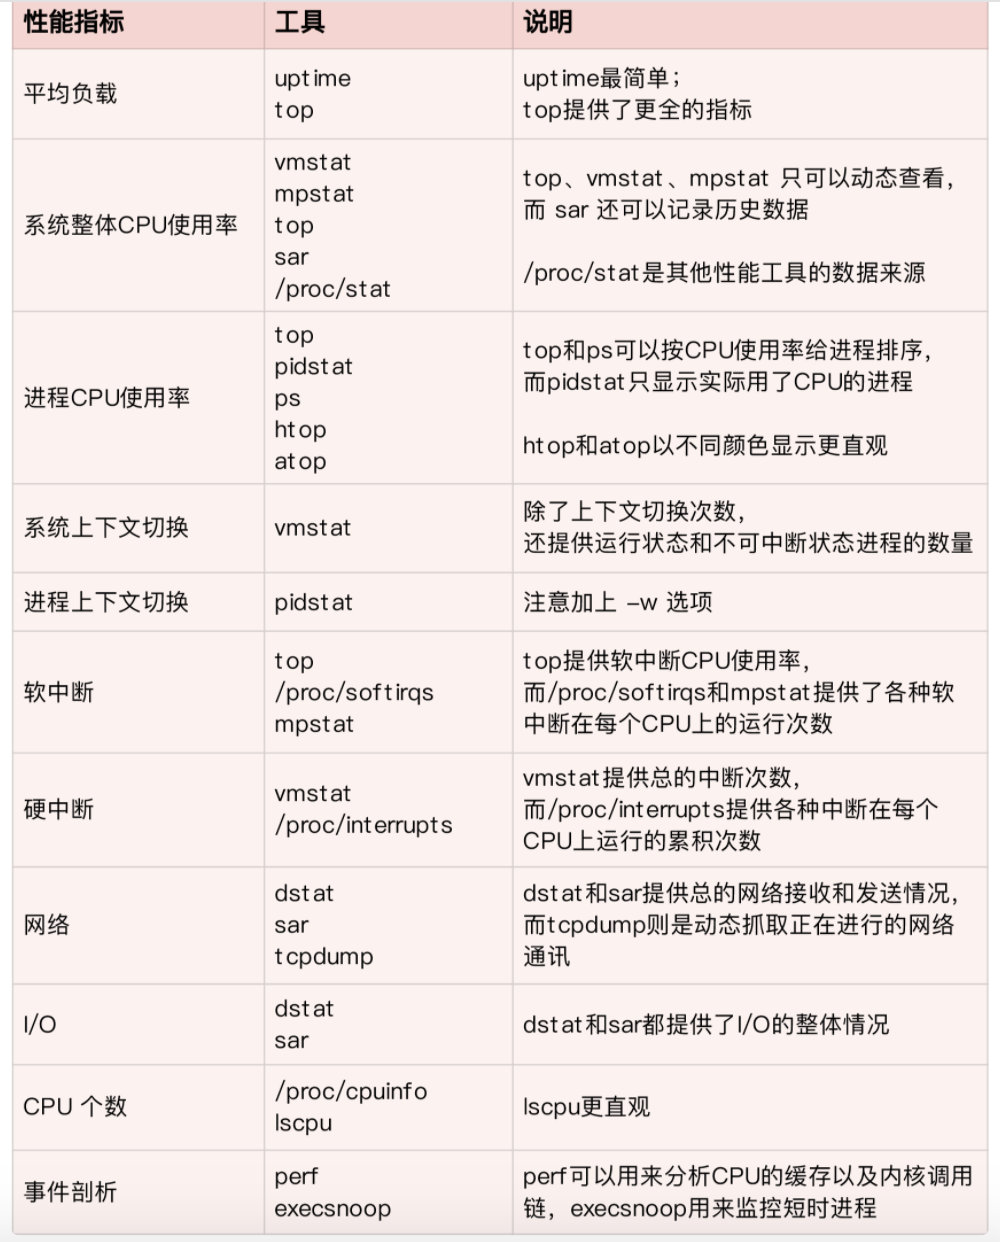
Let me first take a look at the usage of the cpu to show the usage of several commands.
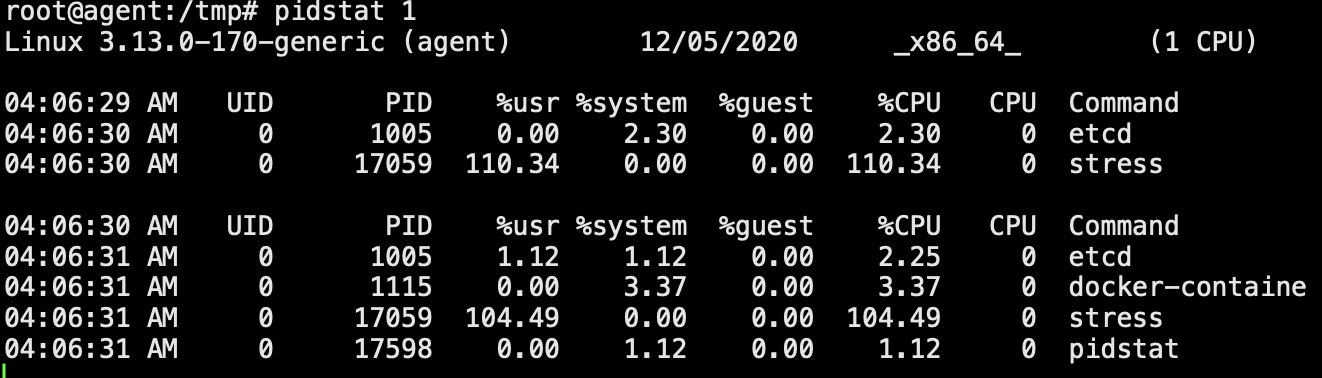
This is the pidstat command, you can view the CPU usage of the process, of course you can also use the top command. But this command can view the CPU usage of kernel mode and user mode.

Use the uptime command to view the average load. So it can be seen that the CPU utilization rate is 100% at this time, and the average load is not very outrageous.
-
IO intensive process
The simulation is that the IO process is running all the time, but in fact the cpu utilization is not terrible, but the average load is very high


The top command cannot see the system occupancy of the kernel mode and the user mode respectively. You can use pidstat 1 to view the user mode and kernel mode occupancy of the process
-
Lots of progression scenes

The simulation is the situation that 8 processes are running at the same time. At this time, let’s look at the average load and cpu usage.

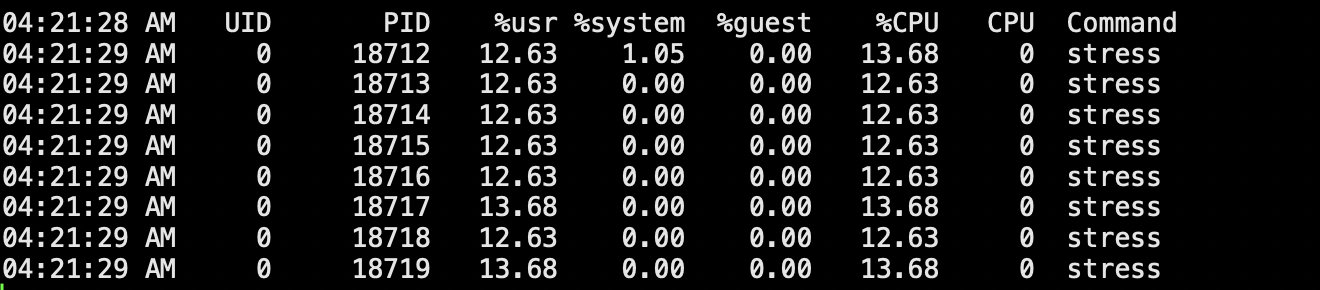
You can see that the load average is high and so is the cpu usage.
Understood, to sum up, top is generally used to check the overall usage of cpu, including memory consumption; pidstat can check the cpu consumption of each process in user mode and kernel mode. vmstat to see the waiting time of io, cs, kernel mode and user mode.
2. CPU context switching
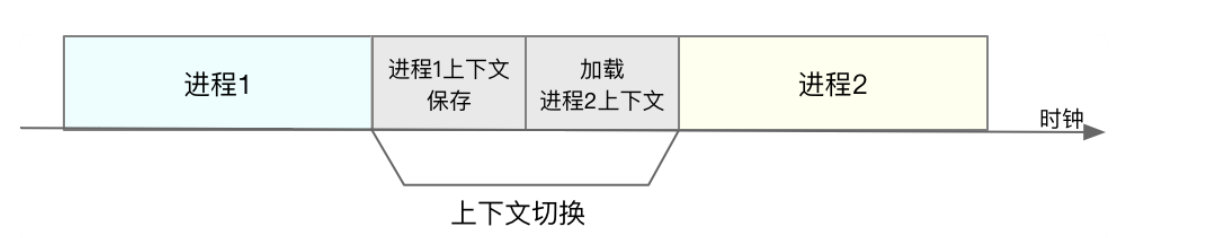
CPU context switching is a very important performance indicator of the Linux system, and frequent context switching will affect the performance of the system. What is context switching? Generally speaking, when the current process or thread exits the CPU, the system will save the CPU register and program counter of the previous process or thread, and then load the CPU register and program counter of the process or thread to run , to run the new task. Switching and saving this time is the key to affecting performance. Context switching is also divided into the following situations.
-
Process context switching
The process is divided into user mode and kernel mode. The kernel mode means that the process needs to interact with the Linux kernel, and the user mode does not need to interact with the Linux kernel. Therefore, process context switching is also divided into two situations, one is that the process transfers from user mode to kernel mode, and the other is switching between two processes.
From user mode to kernel mode, let’s take a look at what this does. The operating levels of Linux can be divided into the following figure, Ring 0 is the highest level, the authority is also the largest, and it directly interacts with the kernel. Ring 3 is in user mode, with limited permissions, and can only access kernel resources through system calls.
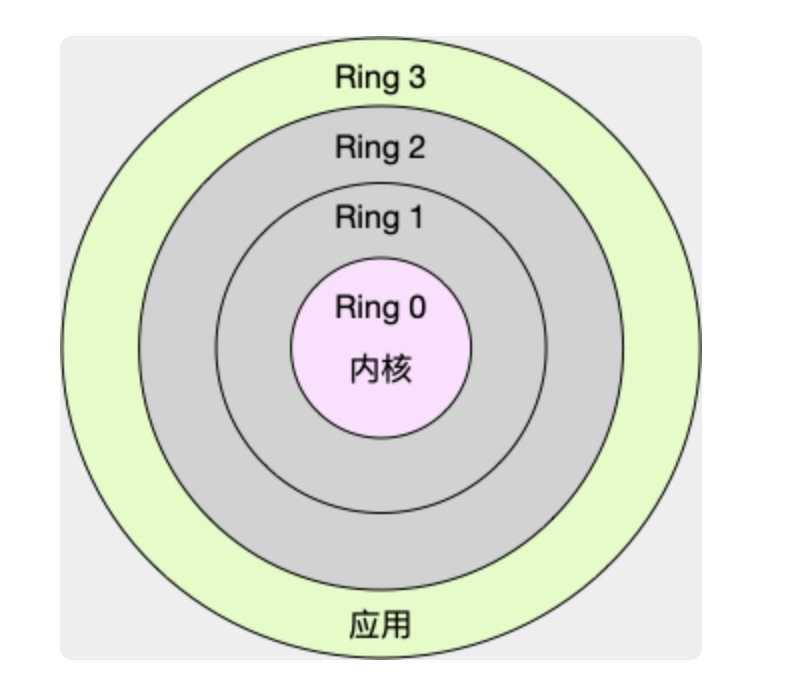
For a call from user mode to kernel mode, the CPU actually performs two context switches. The first time is to save the instruction position of the user mode, execute the kernel code, update the kernel instruction, and jump to the kernel for execution; after execution , to restore to the user state, the CPU registers restore the original saved user state, and then switch to the user space. So two context switches happen.
Compared with system calls, the context switching of the inter-process kernel mode requires more information to be saved. For example, when a CPU process is switched from one to another, not only the CPU registers and program calculator must be saved, but also the virtual memory, stack, etc. . So resource consumption and time will be more.
-
Thread context switching
A thread is a task running in a process. If there is only one thread in a process, thread switching can be considered as switching between processes. When there are multiple threads in a process, because multiple threads share the virtual memory and global variables of the process, the CPU only needs to save the private data, registers and unshared resources of the threads when switching between threads. Switching is much more efficient than switching between processes.
-
interrupt context switch
The priority of the interrupted process is higher than that of the ordinary process, and the interrupted process occurs in the kernel mode, so the interrupted process interrupts the process of the user mode, and there is no need to save and restore user resources such as virtual memory and global variables of this process. The interrupt context actually only includes the state required for the execution of the kernel mode interrupt service program, including CPU registers, kernel stack, hardware interrupt parameters, etc.
3. Uninterruptible and zombie processes
Let’s first review the several states of the process, which should be checked frequently during normal analysis and viewing.
R: running state process
D: Uninterruptible state process, generally when the process interacts with the hardware, the interactive process is not allowed to be interrupted by other processes or interrupts
Z: Zombie state. This is after the child process exits, the parent process does not recycle the child process, resulting in a zombie state. Generally, the parent process has a wait function to recycle the status of the child process
S: The status process can be interrupted. Indicates that the process is suspended by the system because it is waiting for an event, and can be awakened into the ready and running state
T: Suspended state, for example, when the process is running, after sending a SIGSTOP signal, the process is in a suspended state, and can be resumed by the fg command
I: Idle
Therefore, when performing system analysis, if there are a large number of unavailable state processes, that is, D state processes, the IO problem of the system must be considered.
As for the zombie process, under normal circumstances, it will not affect the performance of the system, but if there are a large number of zombie processes, the PID number of the system may be used up. To clean up the zombie process, you can kill the parent process or wait for the init process to recycle.
4. Analyze CPU performance indicators
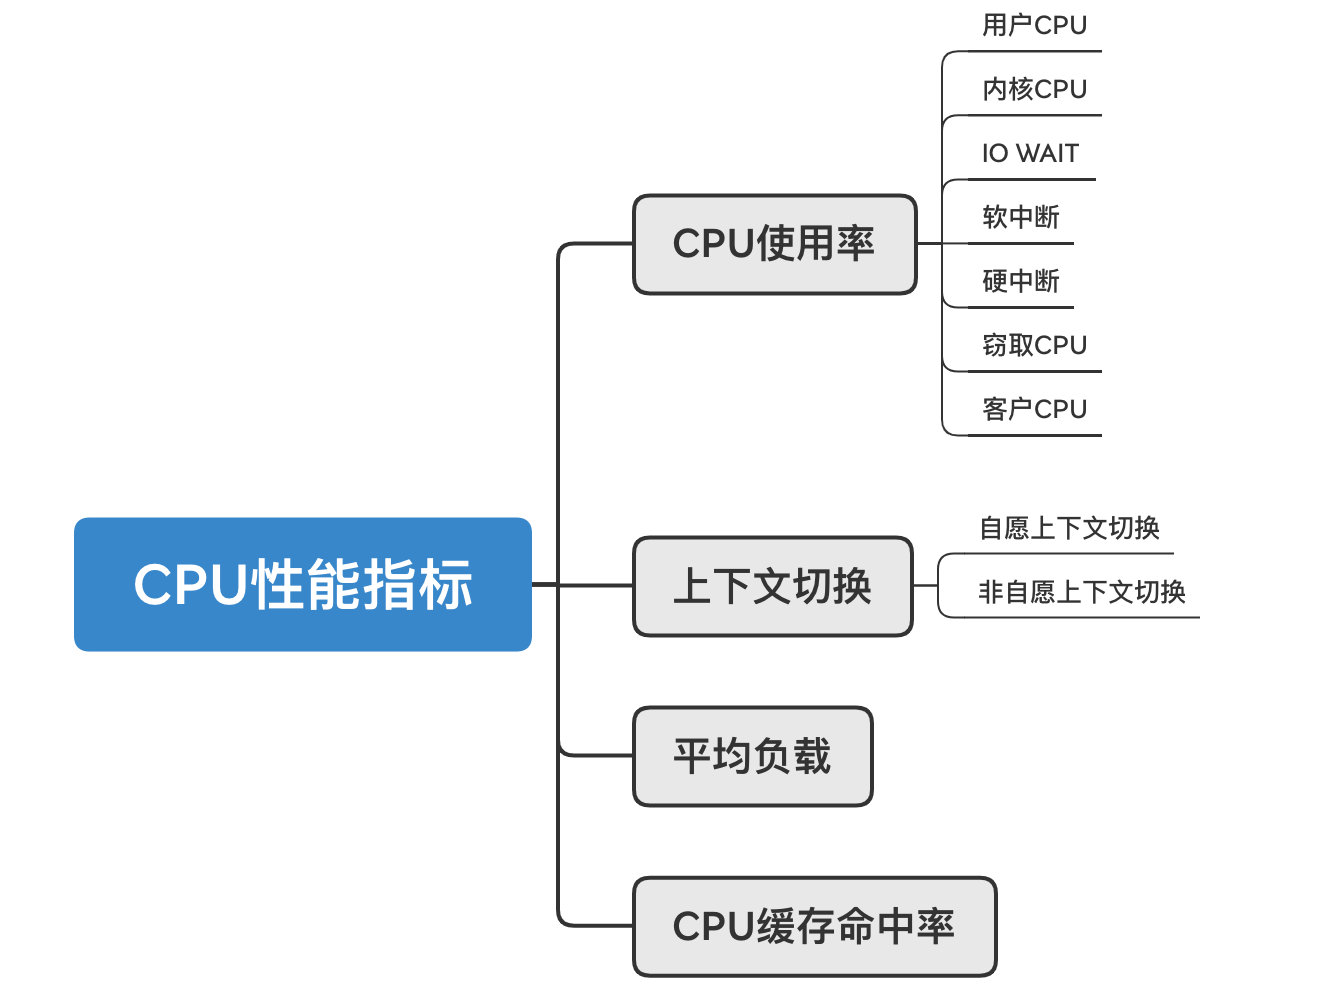
This is also the most critical part of the practical part, that is, if there is a CPU problem, from what angles can we analyze it? First, it must be the CPU usage rate. The CPU usage rate includes user CPU, kernel CPU, waiting for IO, interrupt, and stealing CPU. Client CPU. The second is context switching. The third is the average load. Fourth, the hit rate of the CPU cache. There is a cache between the CPU and the memory, and hot data is usually written into the cache. The hit rate of the cache can greatly improve the performance of the CPU.
Let’s briefly talk about voluntary and involuntary context switching.
***Voluntary context switching: refers to the context switching caused by the inability of the process to obtain the required resources. Such as IO, memory and other resources are insufficient. ***
Involuntary context switching: the inter-process time slice has been exhausted, and is forced to be scheduled by the system, and then the context switching occurs
5. Tools